What can we learn about trends in trade of an illicit good from looking at how the number of seizures of an illegal good changes over time?
Let us suppose we have the following information. Suppose the law enforcement agencies within a country report seizing 50 shipments of illegal goods* in time period A, 75 in time period B and 25 in time period C which we could display very simply as below.
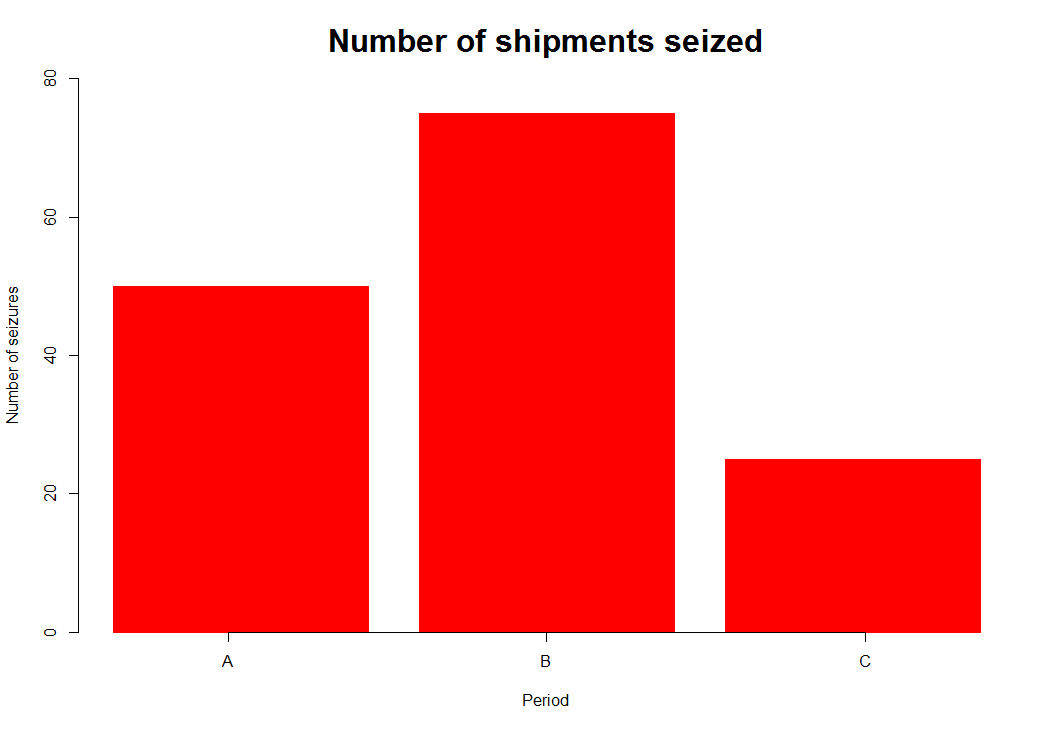
Number of seizures
What can we learn from this?
We know that the law enforcement agencies are unlikely to have seized all of the illegal shipments in the country in each time period so we know that these do not represent all of the illegal shipments in the country. But we can say that at a minimum there were 50 shipments of illegal goods in the country in period A, 75 in period B and 25 in period C.
Can we say anything else? Even though we don’t know how much activity there really is can we use how the change in the number of seizures to say something about how trade activity has changed between periods?
For example, we know that the number of seizures increased by 50% from period A to period B and decreased by two thirds from period B to period C. Does this mean that illegal activity (or trade) increased by 50% from period A to B and decreased by two thirds from period B to period C?

Number of seized shipments showing percentage change between periods
I would argue that unless you know the context within which the seizures were made you cannot say that the change in the number of seizures reflects the change in illegal activity. In particular you need to know whether the seizure rate (proportion of illegal shipments in the country that are seized in each period) remains the same. If it differs then you cannot use a change in the number of seizures to describe changes in the illegal trade. The seizure rate could change for many reasons. For example changes in any of the following may lead to a different seizure rate: the resources (eg staff and equipment such as X-ray machines or dogs at customs) available to law enforcement agencies to detect and make seizures; the ability to detect seizures (eg more training, improved intelligence as law enforcement agencies learn from previous seizures where illegal good are hidden, or decreased intelligence as criminal networks change how they transport illegal goods); socio-economic environment (eg a change in governance, corruption, economy, development, legislation).
Let’s consider three different scenarios. These are illustrated by the figure below. The red shows the number of seizures made and the grey the number of shipments that were not seized. The two together show the total number of illegal shipments – that is the total illegal activity in that period. The numbers in white are the seizure rates – the proportion of the shipments which were seized. In each scenario the same number of seizures have been made in the three periods, as above, but the seizure rate and therefore the total number of shipments has changed.
Scenario 1: This is the scenario we would like to be true. Here the proportion of shipments that are seized remains the same in all three periods. Then the percentage change in the number of seizures reflects the percentage change in the number of shipments.
Scenario 2: In period B there were the same number of illegal shipments in both periods A and B. But, the seizure rate has increased from period A to period B; that is a greater proportion of illegal shipments that are in the country are seized. So the increase in seizures is because of a higher seizure rate rather than more illegal activity and so the change in number of seizures from period A to period B does NOT reflect changes (or no change) in illegal activity. In period C the seizure rate remained the same, but the number of shipments decreased so this provides an accurate reflection of the change in illegal trade. The decrease may be because some of the criminal networks have decided it is not worth sending illegal shipments through this country as there is a much increased chance of them being caught.
Scenario 3: Periods A and B are the same as scenario 2 so that the increased number of seizures does not reflect an increased amount of illegal activity but improved seizure rates. In period C, the seizure rate has decreased but the illegal trade has increased. Thus the change in number of seizures (67% decrease) does not reflect the 20% increase in shipments. One possible reason for the change between period B and C in amount of trade is that as a country’s ability to make seizures decreases so it becomes a more favourable route for illegal goods.
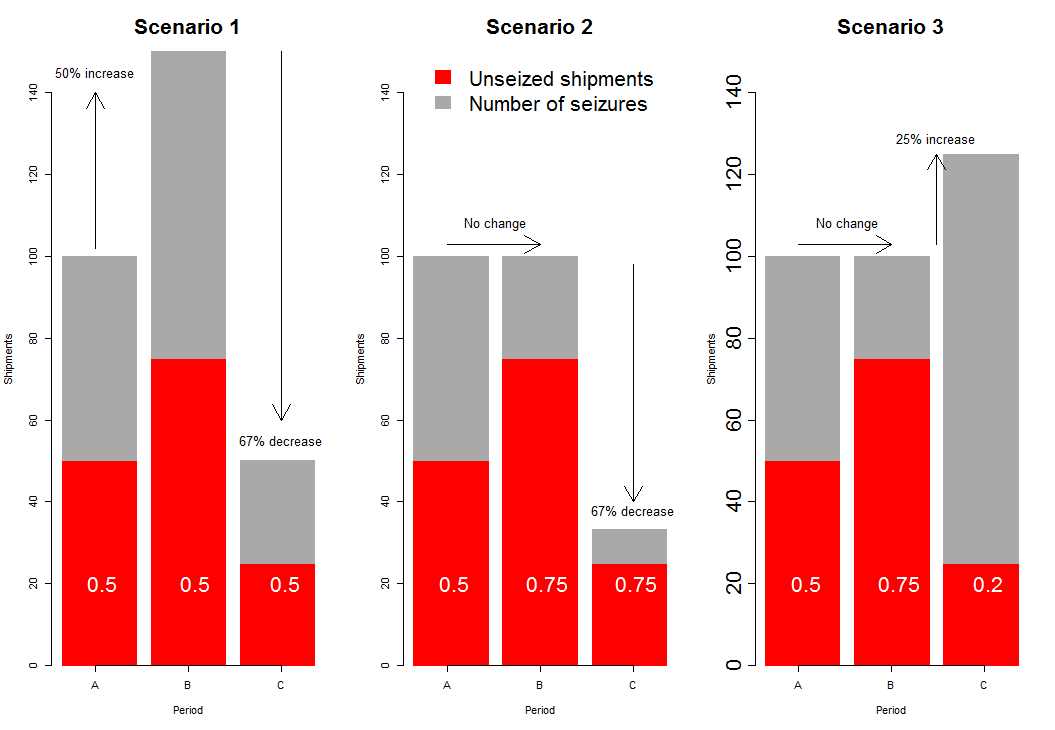
Seized and unseized shipments, seizure rate and percentage change in total number of shipments (seized and unseized combined)
So three scenarios, the same number of seizures in each but total different possibilities for the trade. In practice, the seizure rate is unknown and it can be difficult to work out how it might have changed. So it is dangerous to report on changes in the number of seizures as if it was saying something meaningful about changes in the amount of illegal activity.
Similarly using the number of seizures made by two different countries to compare the activity in these two countries is also not possible; countries may have very different seizure rates.
In later blogs I will talk about one strategy we have used to try and estimate changes in illegal trade using seizures data and it is also described in our paper here.
If you have any thoughts about what might cause the seizure rate to vary either over time or between countries then please post below. Thanks!
* Note that for now I am assuming that seizures all remain the same size so that we can focus only on the number of seizures. It is of course much more complicated than this.
 Email
Email Print
Print
Leave a Reply